Introducing the Labii Status Page: Real-Time Visibility into Service Health
Published on November 12, 2026
Reliable laboratory operations depend on knowing whether the systems behind your work are available. Today, we are introducing the Labii Status page, a public source for current service health, uptime history, incident updates, and planned maintenance information across Labii.
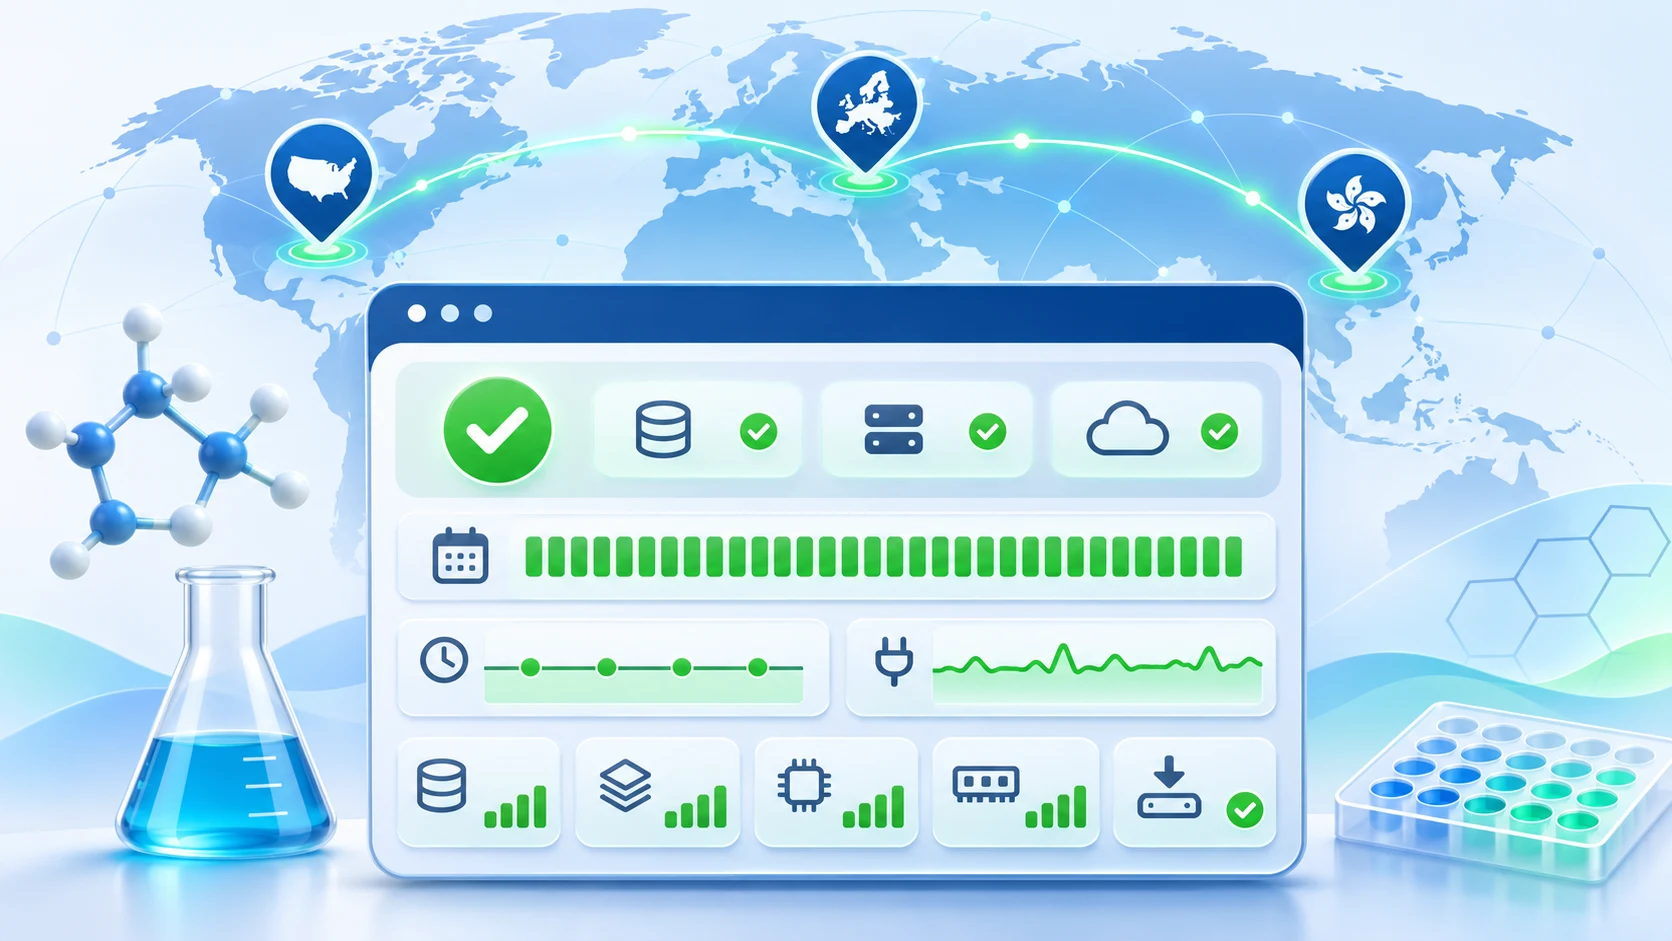
The page gives scientists, laboratory staff, administrators, and technical teams a quick way to check Labii before spending time troubleshooting a local connection or workflow. It is available without signing in and is separate from the Labii application, so it remains easy to find when service information matters most.
One View of Labii Service Health
The status page organizes monitoring into clear service groups. It reports on Labii websites, including the main website, documentation, and blogs, as well as Labii ELN & LIMS services in the United States, Europe, Hong Kong, and the test environment.
For each supported data center, the page monitors important components such as:
- The Labii web application
- The Labii API
- The background task queue
- Server CPU and memory
- Daily backups
Each service shows its current condition along with recent uptime information. This component-level view helps users distinguish a broad service interruption from an issue limited to a particular region or part of the platform.
Automated Checks Every Five Minutes
Labii automatically checks the monitored services every five minutes. When a check identifies a service problem, the status system can open an incident; when the service recovers, it can resolve the incident. This creates a timely, consistent record without requiring users to wait for a manual announcement.
The page also presents 90 days of uptime history. Teams can review recent availability patterns and see when a service was operational, degraded, or unavailable. Because the status is updated continuously, the page should be consulted for the latest information rather than relying on a screenshot or an older report.
Incident History and Planned Maintenance
Current status is only part of the picture. The dedicated incident history records previous events and their resolution, providing a useful timeline when teams need to understand a recent interruption.
Planned maintenance will also be announced on the status page. Laboratory administrators can check the page before important work, integrations, or scheduled runs to see whether a maintenance event may affect the services their teams use.
Status Data for People and Systems
The main dashboard is designed for quick human review, but Labii also publishes machine-readable status resources:
These resources make it possible for technical teams to incorporate Labii service health into internal dashboards, monitoring tools, or automated workflows. The Atom feed also provides a convenient way to follow incident updates without repeatedly refreshing the page.
What to Do When You Experience a Problem
If Labii is not behaving as expected, start with status.labii.com:
- Check the overall service status.
- Review the region and component relevant to your Labii environment.
- Open any active incident for the latest update.
- Review incident history and planned maintenance.
If the page does not report a matching service issue, the problem may be limited to a local network, browser, account, or workflow. In that case, continue local troubleshooting or contact Labii Support with the relevant details.
Bookmark the New Status Page
The Labii Status page is designed to make service communication more transparent and operational decisions easier. Bookmark https://status.labii.com/ so your team always has a direct source for current Labii service health, uptime, incidents, and maintenance information.