> For the complete documentation index, see [llms.txt](https://blogs.labii.com/llms.txt). Markdown versions of documentation pages are available by appending `.md` to page URLs; this page is available as [Markdown](https://blogs.labii.com/feature-updates/2018-10-14-labii-introduces-cutting-edge-eln-feature-for-the-visualization-of-gene-sequences.md).
# 2018-10-14 Labii Introduces Cutting Edge ELN Feature For The Visualization Of Gene Sequences
As technology continues to make waves in research and the molecular biology industry, [Labii](https://www.labii.com/) is staying true to its mission of working daily to develop new amazing [Electronic Lab Notebook (ELN)](https://www.labii.com/electronic-lab-notebook-eln) and [Laboratory Information Management System (LIMS)](https://www.labii.com/laboratory-information-management-system-lims) facilities for scientists.
Added to the many unique [Labii ELN & LIMS](https://www.labii.com/) features, recent innovation sees the data management software capable of gene sequence visualization.
## **What Can Labii Do Now?**
This development allows [Labii](https://www.labii.com/) users to plot publication quality circular and linear sequence maps of the plasmid. They would be able to do this a lot more conveniently using data directly from their [Electronic Lab Notebook (ELN)](https://www.labii.com/electronic-lab-notebook-eln) without an external application.
Plasmid refers to an extra-chromosomal element, typically a small circular DNA strand with self-replicating properties found in the cytoplasm of some bacterial cells. Plasmids are used widely in laboratory gene manipulation serving as vectors for new genes introduced into bacteria. They facilitate the recognition of foreign “recombinant” DNA by the protein-making mechanism of a cell.
Plasmid maps are graphical representations of plasmids, showing the locations of main identifiable landmarks on DNA such as restriction enzyme sites, plasmid name, length, genes of interest, etc.
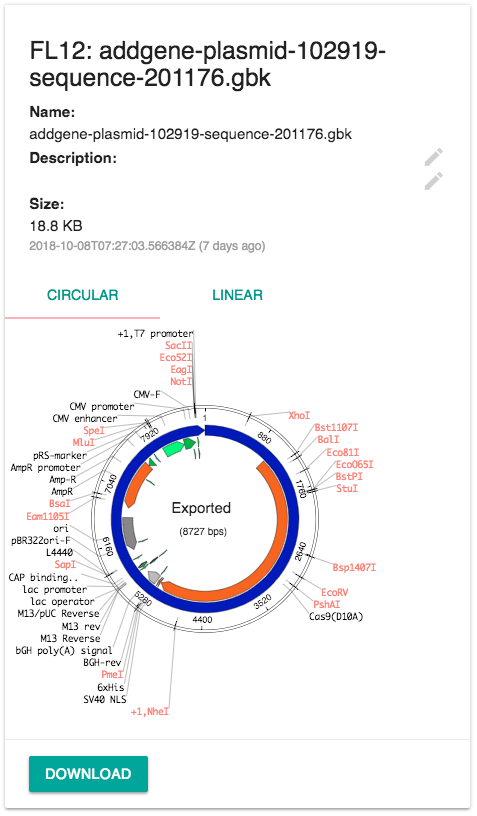
[Using the file widget of Labii](https://docs.labii.com/widgets/file), scientists can now generate first-class plasmid map displays and the supported file types are [\*.gb, \*.gbk](https://fileinfo.com/extension/gbk), and [\*.ape](http://jorgensen.biology.utah.edu/wayned/ape/).
Genbank File Preview For a Plasmid Map (Circular)
## **Benefits of Labii’s Collaborative Integration of Cutting-Edge Sequence Visualization**
This new high-tech [Labii](https://www.labii.com/) feature integrated into the [ELN](https://www.labii.com/electronic-lab-notebook-eln) means the software can be used to turn GenBank annotations into circular and linear sequence maps in no time. And more.
Data for plasmid mapping appears to be complex puzzle pieces which conventionally needed to be fitted together through somewhat tedious trial and error processes. Getting considerable automated assistance from [Labii](https://www.labii.com/)’s futuristic and collaborative platform is a major turning point in sequence visualization.
Plasmid maps are used to plan cloning strategy and to verify when a DNA clone has been successfully constructed. These massively important graphics have so many related applications for scientists and this addition makes [Labii](https://www.labii.com/) an even more complete molecular Biology package.
There are many extra benefits of this integration in comparison with other isolated sequence visualization programs.
One major advantage of using [Labii](https://www.labii.com/) is the facility of uniform visualization which happens through custom annotation libraries. Teams can share their sequences and tools for everyone to be on the same page from the very beginning of experiments. Beyond that, the scientists across teams and bigger organizations get the opportunity to visualize sequences exactly in the same way.
The unique flexibility of [Labii](https://www.labii.com/) extends even more with its new sequence visualization feature. Proper standardization is a key requirement in research and [Labii](https://www.labii.com/) duly recognizes this with top-notch multi-sequence alignment tools. Prestored tools and powerful import features from high-standard external databases allow scientists to standardize visualization all through their organizations, in spite of the particular needs of individual teams.
Multiple sequence comparison is an extremely rare facility for your [Electronic Laboratory Notebook](https://www.labii.com/electronic-lab-notebook-eln) and uncountable professionals in this domain will jump to this without a second thought.
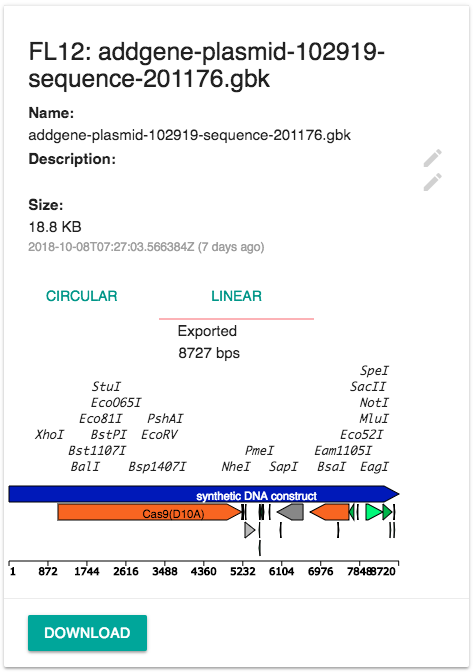
Genbank File Preview For a Plasmid Map (Linear)
## **What’s next?**
[Labii](https://www.labii.com/) is dedicated to continuous innovation and improvement. So, with this release, you can expect much more very soon. We are working on adding the widget that will allow the editing of the plasmid sequences, enabling scientists to design the sequence directly in [Labii ELN & LIMS](https://www.labii.com/). To learn more, schedule a meeting with [Labii](https://www.labii.com/) representatives ([https://call.skd.labii.com](https://call.skd.labii.com/)) or create an account () to try it out yourself.
Simply remarkable!
by Shirley Scott